


Moodle performance issues rarely appear overnight. They build up slowly as enrolments grow, more activities are added, and plugins multiply. For non technical owners, it can be hard to know whether a quiz taking six seconds to load or a certificate taking half a minute to generate is “normal” or a serious warning sign. This article explains how to detect and anticipate Moodle performance issues, outlines acceptable load time benchmarks, reviews common monitoring tools, and shows how to use structured benchmarking to keep your site fast and reliable.
I am Director of Rahab Ministry (a program of Youth Unlimited). We are impressed with Mindfield’s IT specialists in helping us redesign a website (Rahab.yugta.ca) and their ongoing support. They were responsive and helped us think ahead instead of waiting for us to tell them what needed to be done. We will continue to look forward to their support.
Joanna Yee
Director, Rahab Ministry.
review Source: Google Reviews
Outline
-
-
What Moodle Performance Issues Look Like in Real Life
-
Why Moodle Performance Degrades Over Time
-
Impact on Learners, Administrators, and Operations
-
Tools and Strategies to Detect Performance Issues
-
Performance Tool Comparison Table
-
Why a Moodle Performance Expert Makes All the Difference
-
Frequently Asked Questions(FAQs)
-
What Moodle Performance Issues Look Like in Real Life

For a non technical owner, performance problems rarely show up as error codes. Instead, they appear as small frustrations that slowly become normal. Common symptoms include:
-
Course and dashboard pages taking more than two or three seconds to load on a regular basis
-
Quizzes that hang for several seconds before starting or submitting attempts
-
Certificates that take so long to generate that learners try again or open multiple tabs
-
H5P activities that feel laggy or display a loading spinner for extended periods
-
Random slowdowns during busy times, such as exam periods or major course launches
These issues often come with increased support tickets, complaints that “the system is slow today,” and learners abandoning activities halfway through.
Understanding these symptoms and pairing them with realistic load time targets is the first step in anticipating deeper Moodle performance problems.
Why Moodle Performance Degrades Over Time

Moodle is a flexible platform that can support everything from small training sites to large, high traffic learning environments. Over time, however, performance can degrade as courses, users, plugins, reports, and activity data accumulate. This is usually the result of several layers interacting, not a single broken feature.
Typical degradation patterns look like this:
• User growth without capacity planning: More learners, courses, and instructors are added without reviewing hosting resources.
• Plugin and theme overhead: New plugins or themes introduce extra database queries, scripts, and background tasks.
• Large log and activity tables: Reports, completion tracking, and course pages become slower as historical data grows.
• Long running cron tasks: Messaging, completion updates, notifications, and reports are delayed.
• Peak usage pressure: Exams, enrolment periods, and compliance deadlines expose bottlenecks in database, storage, and PHP code.
• Slow performance becomes normalized: Small delays are accepted until they become major user experience or operational problems.
Behind the scenes, root causes often include:
• Under sized hosting: Servers or virtual machines are not adjusted as Moodle usage grows.
• Unoptimized database tables: Large tables, missing indexes, or heavy reports slow down common actions.
• Heavy plugins or custom code: Plugins and custom Moodle code can create slow queries or long running processes.
• Weak caching configuration: Missing or poorly configured Redis, Memcached, or Moodle caching can increase page load times.
This is expected when growth is not paired with proactive performance benchmarking, monitoring, and maintenance.
Impact on Learners, Administrators, and Operations

When Moodle performance issues are left unchecked, they create measurable impact across the entire organization:
• Lower learner satisfaction: Students and staff lose patience with slow pages, incomplete activity loads, and delayed submissions.
• Increased support burden: Help desks receive more tickets about slow performance, which can be difficult to reproduce without monitoring data.
• Business and compliance risk: Delays in quiz submissions, report generation, certificates, or completion tracking can affect contracts, audits, and learner commitments.
• Unclear accountability: Without clear benchmarks, it is difficult to know whether hosting, Moodle configuration, content design, plugins, or custom code are responsible.
As a practical baseline, most well optimized Moodle sites should aim for:
• Core Moodle pages: Under 2 seconds
• Course pages and dashboards: Under 2 seconds for normal usage
• Quiz start and submission screens: Under 3 seconds
• Certificate viewing or generation: Under 2 seconds where possible
• H5P and SCORM content: 3 seconds or less
• Reports and large admin pages: Longer times may be expected, but repeated delays should still be investigated
When your site consistently exceeds these ranges, it is a strong signal that deeper performance diagnostics are required.
Tools and Strategies to Detect Moodle Performance Issues

Below are recommended approaches for detecting and anticipating Moodle performance issues, ordered from the most accessible to the most advanced.
1. Use the Moodle Benchmark Plugin for Quick Health Checks
The Moodle Benchmark plugin provides a simple way to run synthetic tests against your environment.
Advantages include:
• Clear performance categories: Database, processor, file system, and caching performance can be reviewed separately.
• Easy access from Moodle: Administrators can run checks from the Moodle interface without needing direct server access.
• Useful before and after upgrades: Benchmark scores can be compared before and after Moodle upgrades, plugin changes, or hosting changes.
• Shared reference point: Results can help owners, developers, and hosting providers discuss performance using the same evidence.
• Good early warning system: Sudden benchmark drops can reveal issues before users report them.
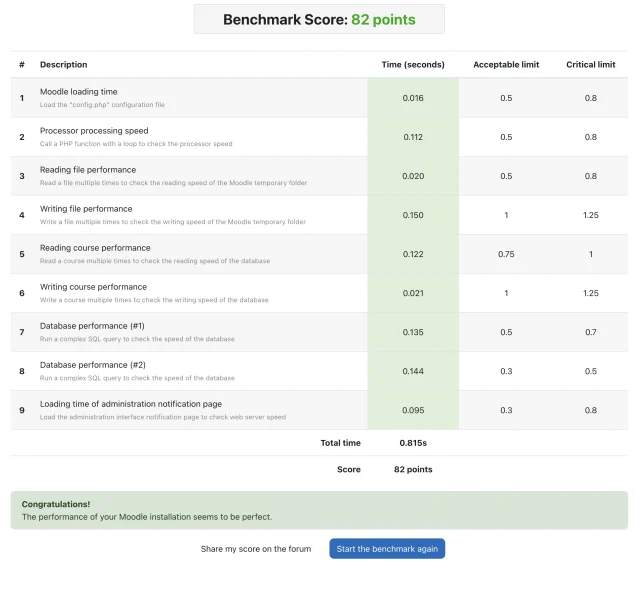
This method is ideal for non technical owners who need a quick health snapshot of their Moodle instance.
2. Use Application Performance Monitoring (APM) for Deep Diagnostics
Application Performance Monitoring tools provide deeper visibility into how Moodle behaves under real traffic. These tools are especially helpful for organizations that depend on Moodle for large cohorts, compliance training, ecommerce, reporting, or certification.
These tools can help you:
• Track slow database queries: Identify specific queries that delay course pages, reports, or completion tracking.
• Review PHP code performance: Find slow Moodle scripts, custom code paths, plugin functions, and external service calls.
• Analyze real user transactions: See how actual users experience the site during normal and peak usage.
• Compare performance over time: Review trends before and after upgrades, course launches, or plugin changes.
• Set alert thresholds: Notify teams when response times exceed acceptable limits.
• Support hosting conversations: Provide evidence when server resources, caching, storage, or database tuning need review.
This is the standard approach for organizations that rely heavily on Moodle and need predictable performance at scale.
3. Use Browser Developer Tools to Spot Front End Bottlenecks
Browser developer tools are useful when Moodle feels slow on specific pages, especially pages with large images, media, H5P, SCORM packages, custom themes, or plugin generated content. They do not replace server monitoring, but they can quickly show whether the slowdown is happening in the browser experience.
Useful browser tools include:
• Google Chrome DevTools: Strong Network, Performance, Lighthouse, and JavaScript analysis tools.
• Microsoft Edge DevTools: Similar to Chrome because it is Chromium based, useful for testing corporate Windows environments.
• Mozilla Firefox Developer Tools: Helpful for network, layout, accessibility, storage, and performance review.
• Safari Web Inspector: Useful when testing Moodle behavior for Mac and iOS users.
• Lighthouse: Built into Chrome and Edge, helpful for identifying performance, accessibility, image, script, and rendering issues.
What to check in browser developer tools:
• Network waterfall: Look for large files, slow requests, blocked resources, or repeated requests.
• Image size: Oversized banner images, course thumbnails, and plugin images can slow down page rendering.
• JavaScript load: Heavy scripts from themes, tracking tools, or plugins can delay interaction.
• CSS and render blocking resources: Large stylesheets or theme assets can delay visible page rendering.
• H5P and SCORM loading: Interactive content should ideally load within 3 seconds or less.
• Cache behavior: Repeated page loads should reuse browser cache where appropriate.
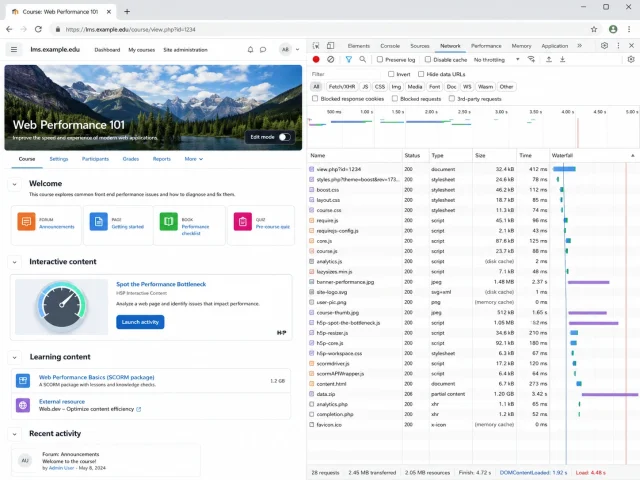
This section is especially useful when only certain course pages feel slow. For example, if the dashboard loads quickly but one course page is slow, browser tools can show whether the issue is caused by oversized images, embedded media, third party scripts, SCORM packages, or theme assets.
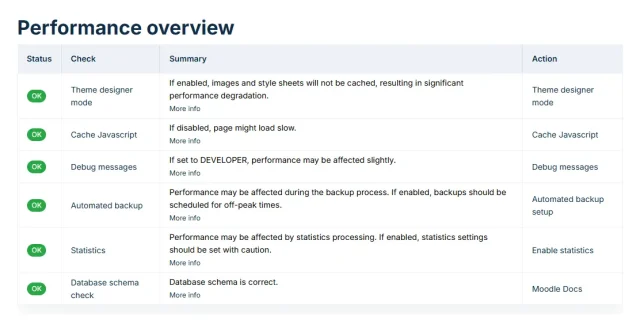
4. Use Moodle Logging and Profiling to Trace Slow Pages
Moodle’s own logging and profiling tools can help administrators see which pages and actions are slow under real usage. These tools require more technical interpretation, but they can provide valuable evidence for targeted fixes.
Useful actions include:
• Enable profiling carefully: Capture slow script execution paths when investigating specific issues.
• Review Moodle logs: Identify which users, activities, or reports were active during slow periods.
• Check scheduled tasks: Long running cron tasks can delay notifications, completions, reports, and enrolment updates.
• Compare affected pages: Determine whether slowness affects the entire site or only specific courses, activities, reports, or plugins.
• Gather evidence before changing settings: Logs and profiling help avoid guesswork and unnecessary configuration changes.
5. Review Related Moodle Performance Guidance
Performance issues are rarely isolated. A slow Moodle site may involve hosting, caching, plugins, course design, backups, database growth, or multi tenant complexity. For deeper troubleshooting, it helps to connect benchmark results with broader performance guidance.
Recommended related articles include:
• How to make Moodle run faster: Useful for hosting, caching, and general speed improvement strategies.
• Why Multi Tenant Moodle Becomes Slow And How to Fix It: Useful when performance issues appear in IOMAD or multi tenant Moodle environments.
• Moodle Maintenance Strategy: Useful for ongoing database, caching, system health, and update planning.
• Moodle Plugin Cleanup Strategies: Useful when plugin bloat, old plugins, or compatibility issues may be slowing the site.
• Slow Moodle Backup Time: Useful when backup, restore, or storage operations are affecting site performance.
While these tools require more technical skill, they give experts the detail needed to design effective performance fixes.
Performance Tool Comparison Table
| Tool | Advantages | Limitations |
|---|---|---|
| Moodle Benchmark Plugin | Simple, free, and easy for non technical administrators | Synthetic tests only, no real user or historical data |
| APM Tools (New Relic, Datadog, etc.) | Deep visibility into database, PHP, and external integrations | Paid, requires server access and technical expertise |
| Browser DevTools and Lighthouse | Great for front end issues and theme related slowdowns | Does not expose backend, database, or cron bottlenecks |
| Moodle Logging and Profiling | Integrated, detailed visibility into slow pages and actions | Requires configuration and interpretation by experienced admins |
Why a Moodle Performance Expert and Benchmark Plugin Make All the Difference

A Moodle performance expert brings architectural insight that goes far beyond ad hoc troubleshooting. They understand how PHP code, database queries, caching layers, cron tasks, and plugins all interact under real load. Instead of treating each slowdown as an isolated incident, an expert uses structured benchmarking and tooling to build a complete picture of your site’s health and capacity.
Working with Mindfield, organizations can pair expert knowledge with a custom benchmarking approach. Our extended benchmarking plugin runs deeper tests that simulate real Moodle activities, such as quiz launches, H5P loading, and certificate generation, and converts them into clear, business friendly reports. Combined with proven optimization strategies, this allows owners to move from firefighting slowdowns to proactively planning capacity, improving user experience, and making confident decisions about their Moodle roadmap.